
Is Cybersecurity an Expense or an Investment?
Most business spending leaves a trail you can measure. A new salesperson brings in orders; new equipment produces more units. Cybersecurity is different. When it works, nothing happens: no outage, no ransom note, no letter to customers. A prevented incident never shows up in your books, so the value of preparedness is hard to see.
One way to make it visible is expected annual loss: the chance of a costly incident in a year multiplied by what that incident would cost. If preparedness lowers the chance, the cost, or both, the drop in expected annual loss is the financial value it creates, on average, over time.
The short answer: yes, cybersecurity preparedness can pay off. Research shows that specific safeguards reduce specific risks, and insurance claims data shows that incidents which disrupt operations cost far more than those that don't. But no study supports a single ROI percentage for every small business. Whether it pays off for you depends on your exposure, which safeguards you choose, what they cost and what an incident would cost you. The rest of this article shows what the research does establish, and how to run the numbers yourself.
What Research Says About Reducing Incidents
Basic controls and the chance of an incident (Gandal et al., 2023)
Economists Neil Gandal, Tyler Moore, Michael Riordan and Noa Barnir studied a government survey of Israeli private-sector firms with more than 10 employees, conducted in 2020–2021 by Israel's Central Bureau of Statistics and National Cyber Directorate (Computers & Security, 2023). Studying security spending is tricky because firms often invest after they are attacked, which makes security look like it causes incidents. The authors addressed this with a statistical technique called an instrumental variable, based on whether firms had implemented a 2017 national cybersecurity directive.
Their headline estimate: for large firms with significant revenues that use e-commerce and cloud services (the riskiest group in the data), adopting all six basic precautions in the survey reduced the modeled probability of experiencing a cyber incident from 80% to 42%, a drop of 38 percentage points, or 47.5% in relative terms. The six were a strong password policy, keeping systems up to date, two-factor authentication, malware detection and response on endpoints and servers, using supported software, and encrypting data, files and email.
Three limits matter before applying this to your business:
- “Incident” means any incident a firm had to handle in the past 12 months, whether or not it caused damage. Only about one in ten firms that handled an incident reported harm. The 80% and 42% are not probabilities of a costly incident.
- The 80% and 42% are model estimates for large, high-risk Israeli firms, not observed rates and not figures for a typical 10-person U.S. business.
- It measures the package, not each control. The authors state that they draw no conclusions about the causal effect of any particular precaution.
Multifactor authentication and account takeover (Microsoft, 2023)
Microsoft researchers examined commercial Azure Active Directory accounts that were reviewed for suspicious activity between April and September 2022 (Microsoft Research). They estimated that multifactor authentication (MFA) reduced the risk of account compromise by 99.22% across that population, and by 98.56% for accounts whose passwords had already leaked.
This is strong evidence, but about one specific outcome: an attacker taking over an account. It does not mean MFA cuts your overall chance of a cyber incident, or your expected losses, by 99%. Attacks that don't depend on stealing a login, such as an unpatched website or a fraudulent payment request, are outside what the study measured. The accounts were commercial accounts in Microsoft's cloud, not a sample chosen to represent small businesses.
Incident response exercises (Marsh McLennan, 2025)
Marsh McLennan's Cyber Risk Intelligence Center analyzed organizations' security control data from Marsh's Cyber Self-Assessment alongside insurance claims (Marsh McLennan, August 2025). Organizations that regularly run tabletop exercises and scenario-based breach response drills were 13% less likely to experience a material cyber event than those that don't. The same release reports that each 25% increase in endpoint detection and response (EDR) coverage across workstations and laptops was correlated with an additional 10% decrease in breach likelihood, and that phishing-resistant MFA was correlated with a 9% lower breach likelihood than other MFA.
These are observed associations among organizations that complete Marsh's assessment, not proof that running exercises will lower any particular organization's risk by 13%. Organizations that drill regularly may differ in other ways too. The public release doesn't define “material cyber event” or describe the sample's size or makeup; the full report sits behind a registration form.
Certified basic controls and insurance claims (UK Cyber Essentials)
Cyber Essentials is the UK government's certification for five basic technical controls. In November 2024 the National Cyber Security Centre reported that, according to data from the provider of the free cyber insurance that comes with certification, organizations with Cyber Essentials certification are 92% less likely to make a cyber insurance claim than those without it (NCSC, November 2024). The NCSC Annual Review 2024 repeats the figure, attributing it to research from insurers (NCSC Annual Review 2024).
Four cautions before reading this as a measure of what certification is worth:
- The outcome is an insurance claim, not every cyber incident. Some incidents are never claimed, and many businesses aren't insured.
- It is an observational comparison. Certified organizations may differ from uncertified ones in ways that have nothing to do with certification, such as size, sector or how seriously they already took security. The NCSC sources don't name the insurer or describe the sample, period or method.
- It is not a prediction of lower losses for any particular business, and it isn't used as a default in the CSFSafe calculator.
- Research note: the NCSC Annual Review 2023 cited an earlier insurer figure of 80% fewer claims, based on 2022 data (NCSC Annual Review 2023). No common method links the two figures, so the difference isn't a measured trend.
What Research Says About Financial Losses
Business interruption drives the cost (NetDiligence, 2026)
NetDiligence's 2026 Cyber Claims Study analyzed 10,309 cyber insurance claims from incidents between 2021 and 2025 (NetDiligence). Among small and medium-sized enterprises, incidents involving business interruption cost more than five times as much, on average, as those without it.
Note how NetDiligence defines SMEs: organizations with less than $2 billion in annual revenue, which make up 97% of its claims. The average SME in the data had about $105 million in revenue. Its averages describe insured organizations that filed claims, many far larger than a typical small business, so they are not a likely loss figure for a 10-person firm. The lesson that does carry over: anything that shortens downtime (tested backups, a response plan, knowing who to call) attacks the most expensive part of an incident.
Claims frequency, severity and ransomware (Coalition, 2026)
Coalition, a cyber insurer, reported on 2025 claims from its more than 100,000 policyholders in the United States, Canada, the United Kingdom, Australia and Germany (Coalition):
- Claims frequency (how often policyholders claimed) rose 3% from 2024.
- Claims severity (the average loss per claim) fell 19%, to $116,000.
- Ransomware was the most costly claim type, with an average loss of $269,000. Initial ransom demands rose 47%, yet 86% of businesses hit by ransomware refused to pay.
These figures describe one insurer's policyholders, who chose to buy cyber insurance and receive the insurer's security services. Claim frequency is not the probability that a typical U.S. small business has a damaging incident, and an average claim is not what a typical incident would cost you.
Most identified attacks cost little (UK Cyber Security Breaches Survey 2025/26)
The UK government's official survey of 2,112 businesses, conducted from August to December 2025 (GOV.UK, April 2026), found that:
- 43% of businesses (46% of small businesses) identified some kind of cyber security breach or attack in the previous 12 months. Phishing was by far the most common.
- 19% of businesses were victims of at least one cyber crime.
- The median cost of the most disruptive breach or attack was £0. Even at the 95th percentile it was £4,000 for micro and small businesses.
Identifying an attack is not the same as suffering a damaging compromise. The survey counts the breaches and attacks businesses noticed, phishing above all, and for the typical business the most disruptive one had no measurable direct cost. That's why the 43% figure is not the probability of a financially damaging incident, and why it shouldn't be plugged into an ROI calculation as one. It is also a UK survey, so its rates aren't a direct estimate for U.S. businesses. The same survey also shows how much room there is to improve: only 47% of businesses used two-factor authentication, and 25% had a formal incident response plan.
The Evidence at a Glance
| Study or report | Population and period | What was measured | Headline result | Important limitations |
|---|---|---|---|---|
| Gandal, Moore, Riordan & Barnir (2023) | Israeli private-sector firms with 10+ employees; national survey 2020–21 | Whether a firm had to handle any cyber incident in 12 months | Six basic controls: 80% → 42% modeled incident probability for the riskiest large firms | Incidents include those with no damage; large high-risk firms; combined effect, not per control |
| Microsoft Research (2023) | Commercial Azure AD accounts reviewed for suspicious activity, Apr–Sep 2022 | Account compromise | MFA: 99.22% lower risk overall; 98.56% with leaked credentials | Account takeover only; not overall incident or loss probability |
| Marsh McLennan CRIC (2025) | Organizations using Marsh's Cyber Self-Assessment, analyzed against claims | Material cyber events; breach likelihood | Regular exercises: 13% less likely to have a material event | Association, not causation; outcome and sample not detailed publicly |
| NCSC on Cyber Essentials (2024) | Insurer data (per NCSC, from the provider of Cyber Essentials' free cover); sample and period not stated | Whether an organization made a cyber insurance claim | Certified organizations 92% less likely to claim | Claims ≠ incidents; observational; insurer, sample and method not published |
| NetDiligence (2026) | 10,309 insurance claims, incidents 2021–2025 | Incident cost | SME incidents with business interruption cost 5×+ on average | “SME” means under $2B revenue; insured claimants only |
| Coalition (2026) | 100,000+ policyholders in five countries; 2025 claims | Claim frequency and severity | Frequency +3%; average loss $116,000 (−19%); ransomware $269,000 | One insurer's customers; not all small businesses |
| UK Cyber Security Breaches Survey (2026) | 2,112 UK businesses; fieldwork Aug–Dec 2025 | Identified breaches or attacks; cyber crime; perceived cost | 43% identified an attack; 19% cyber crime victims; median cost £0 | Includes attempts with no impact; self-reported costs |
Notice that no two rows measure the same thing. Incidents, account compromises, material events, insurance claims and losses are different outcomes, so their percentages can't be added together or swapped for one another. And none of these populations is a typical American small business: they are Israeli firms, commercial cloud accounts, organizations that buy cyber insurance or complete an insurance broker's assessment, and UK businesses. The research shows which safeguards matter and why downtime is expensive; it doesn't supply your probabilities or losses.
How to Calculate Cybersecurity ROI
The basic formula is:
Expected annual loss = annual probability of a costly incident × average loss if that incident occurs
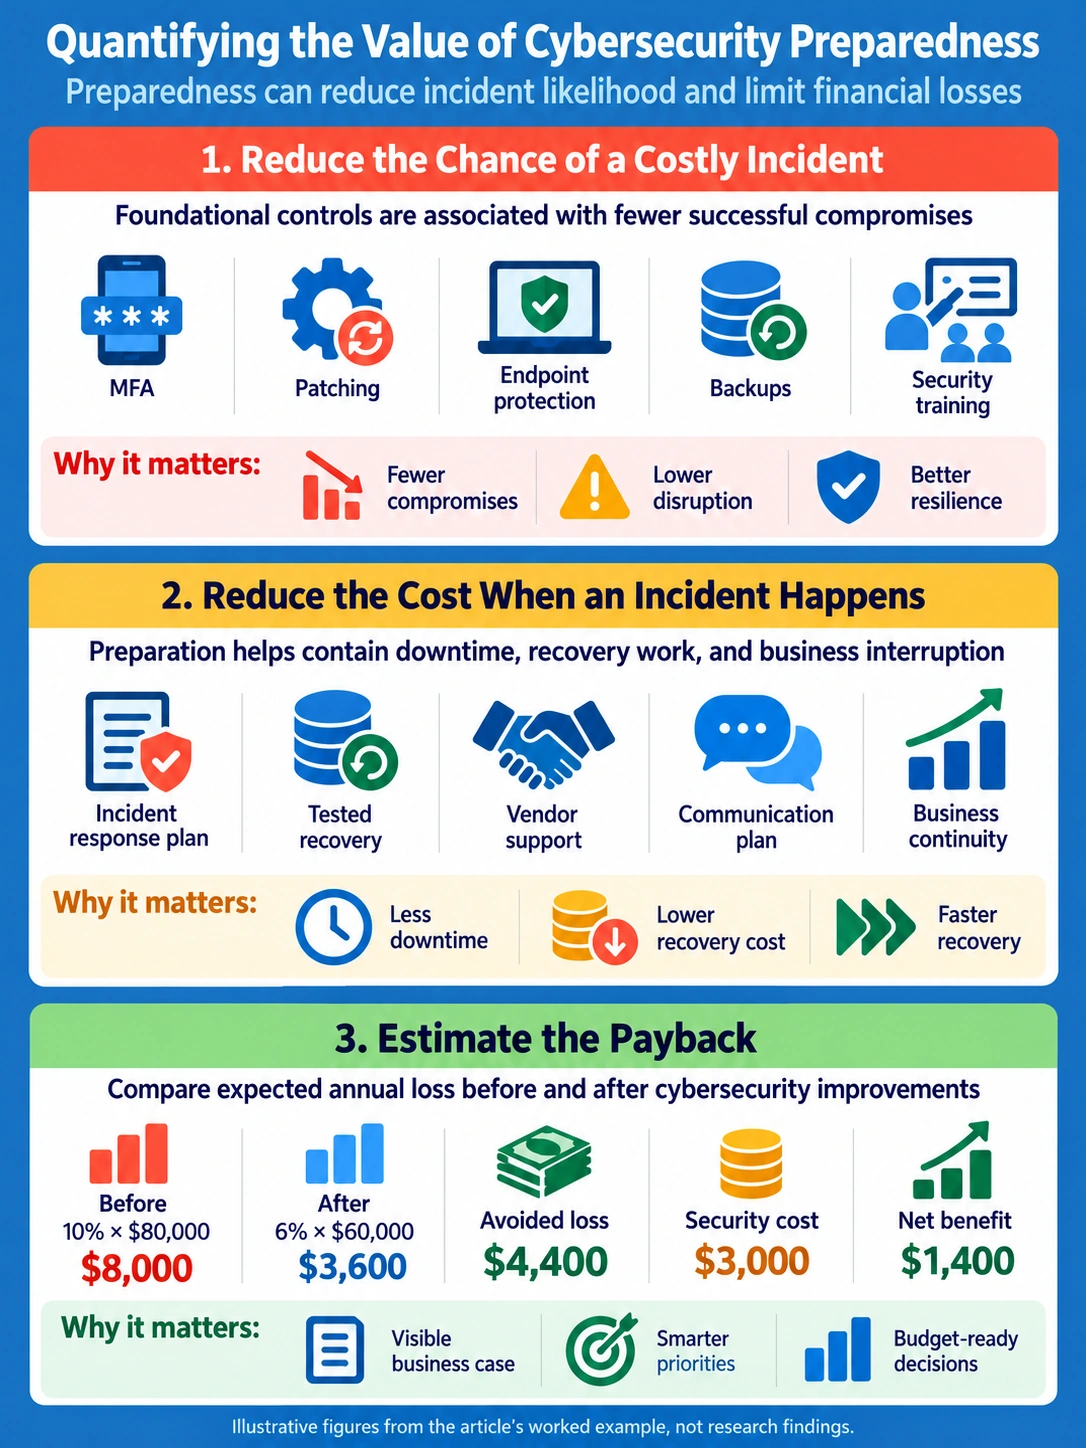
You calculate it twice, before and after the improvements you're considering, and compare the difference with what the improvements cost. Here is a worked example. Every number in it is hypothetical; none is a forecast taken from the studies above.
| Before | After | |
|---|---|---|
| Annual probability of a costly incident | 10% | 6% |
| Average loss if one occurs | $80,000 | $60,000 |
| Expected annual loss | $8,000 | $3,600 |
- Expected annual loss avoided: $8,000 − $3,600 = $4,400
- Annual recurring security cost: $3,000
- Net expected annual benefit: $4,400 − $3,000 = $1,400
- First-year ROI (no one-time cost): $1,400 ÷ $3,000 ≈ 46.7%
The result is very sensitive to the assumptions. Keep everything else the same, but start from a 5% annual probability instead of 10%: expected annual loss falls from $4,000 to $1,800, the $2,200 avoided is less than the $3,000 cost, and the net expected benefit becomes −$800 a year. Start from 20% instead, and the net expected benefit is $5,800 a year. The safeguards and their cost didn't change; only the starting risk did.
Two more things to keep straight. Avoided losses are not cash you receive; they are losses you expect not to incur, on average, over time. And if you reduce both the probability and the cost of an incident, the reductions multiply rather than add, as they do in the example (6% × $60,000).
What Determines the Payback?
Whether preparedness pays back for your business depends on six things:
- Your risk exposure: what you depend on, what attackers could reach, and how attractive a target you are.
- How effective the improvements are against the threats you actually face.
- The financial consequences of an incident, especially downtime.
- One-time costs to put the improvements in place.
- Ongoing costs such as subscriptions, services and staff time.
- Your time horizon: one-time costs are spread over more years the longer you look.
Break-even is the point where expected losses avoided equal what you spend. Each year, the expected losses avoided have to exceed the recurring cost; if they don't, the investment never breaks even under your assumptions, however long you wait. If they do, the surplus gradually pays back any one-time cost. In the example above, adding a $5,000 setup cost makes the first year negative (−$3,600), and the $1,400 annual surplus takes about 43 months to recover it. That is reachable, but after a three-year horizon, so over three years the example still shows a net cost (−$800).
Estimate Your Own Cybersecurity Payback with the free CSFSafe Cybersecurity ROI & Payback Calculator. Enter your own probability, loss and cost estimates, or before-and-after estimates in advanced mode, and see how the result changes if the improvements help less or more than you expect. It uses your assumptions; it doesn't predict attacks.
Where Should Small Businesses Invest First?
Start with the basics that appear again and again in the research and in government guidance such as the FTC's Cybersecurity for Small Business and the NIST Cybersecurity Framework small business resources:
- Multifactor authentication on email, banking, cloud services and remote access. See Access Control.
- Regular updates and patch management, including websites and network equipment. See Patch Management Strategy.
- Endpoint protection on every computer and server.
- Reliable, tested backups, kept where ransomware can't reach them. See Business Continuity and Disaster Recovery Basics.
- An incident response plan that you practice. See Incident Response Plans: Why Every Organization Needs One.
- Employee training on phishing and payment fraud. See Monthly Training.
- An asset inventory and risk assessment, so you know what you're protecting. See Asset Inventory and Classification and Risk Identification and Analysis.
Prioritize by your own exposure, not by generic averages. A business that takes card payments online, one that holds patient records and one that mainly depends on email and accounting software face different risks. Spend first where an incident would hurt most and where a safeguard addresses how attacks on businesses like yours actually happen.
Common Questions
Is cybersecurity worth the cost for a small business?
Often, but not automatically. Basic safeguards such as MFA, updates and tested backups are relatively inexpensive and address common attacks. Research links basic controls to fewer incidents and MFA to far fewer account takeovers, and claims data shows that downtime drives much of the cost. Whether a specific purchase is worth it depends on how much it lowers your expected losses compared with what it costs.
How can a small business calculate cybersecurity ROI?
Estimate your expected annual loss before and after the improvement, subtract to get the expected loss avoided, then subtract the cost. ROI is that net benefit divided by the cost. Because the inputs are estimates, compare a few scenarios rather than relying on one number.
What is annual expected loss?
It's the average yearly cost of a risk: the probability of a costly incident in a year multiplied by what it would cost. A 10% chance of an $80,000 incident is an expected loss of $8,000 a year, even though in most years you would lose nothing.
Can cybersecurity reduce the probability of an attack?
It can't stop attackers from trying, but it can reduce the chance that an attack succeeds and the damage if one does. One study estimated fewer incidents among high-risk firms that adopted a package of basic controls, and Microsoft found far fewer account takeovers with MFA.
What does research actually establish about cybersecurity effectiveness?
That specific controls reduce specific risks (MFA and account takeover is the clearest case), that adopting basic controls together is associated with fewer incidents, and that business interruption is a major driver of cost. Much of the evidence is observational, from particular populations, and measures different outcomes.
Why can't one universal cybersecurity ROI percentage apply to every small business?
Because ROI depends on a business's own risk, potential losses, chosen safeguards and costs, and those vary widely. Published percentages measure different outcomes in different populations, so none can be applied to your business as a guaranteed return.
Conclusion
- Security controls can measurably reduce certain risks. The evidence is strongest for specific controls against specific threats, such as MFA against account takeover.
- Preparedness targets the most expensive part of an incident. In claims data, business interruption drives the cost, and tested backups and a practiced response plan are aimed at shortening it.
- The financial return depends on your business and the safeguards you choose. There is no research-backed universal ROI.
- Prioritize by risk. Spending matched to your actual exposure beats spending on everything.
If you don't know where your business stands, the free CSFSafe Cybersecurity Checkup takes a few minutes and shows which basic safeguards are missing. The CSFSafe Cybersecurity Playbook gives you a structured way to plan, assign and track that work based on the NIST Cybersecurity Framework, which helps you put preparedness in place but can't guarantee any particular reduction in incidents.
References
- Gandal, N., Moore, T., Riordan, M. & Barnir, N. (2023). Empirically evaluating the effect of security precautions on cyber incidents. Computers & Security, 133, 103380 (open-access manuscript)
- Meyer, L. A., Romero, S., Bertoli, G., Burt, T., Weinert, A. & Lavista Ferres, J. M. (2023). How effective is multifactor authentication at deterring cyberattacks? Microsoft Research
- Marsh McLennan (2025). Incident response planning emerges as key cybersecurity control in reducing cyber risk (Cybersecurity signals: Connecting controls and incident outcomes)
- National Cyber Security Centre (2024, November 15). A decade of Cyber Essentials: the journey towards a safer digital future
- National Cyber Security Centre (2024). NCSC Annual Review 2024, Chapter 02: Building the UK's cyber resilience
- National Cyber Security Centre (2023). NCSC Annual Review 2023
- NetDiligence (2026). NetDiligence publishes sixteenth annual Cyber Claims Study
- Coalition (2026). 2026 Cyber Claims Report
- Department for Science, Innovation and Technology and Home Office (2026). Cyber Security Breaches Survey 2025/2026
- Federal Trade Commission. Cybersecurity for Small Business
- NIST. Small Business Cybersecurity Corner